To save results or sets tasks for your students you need to be logged in. Studyladder is free to join Join Now, Free
What a brilliant site you have!!! I love it, especially as it saves me hours and hours of hard work. Others who haven't found your site yet don't know what they are missing!
Mathematics
2.MD.10 – Draw a picture graph and a bar graph (with single-unit scale) to represent a data set with up to four categories. Solve simple put-together, take-apart, and compare problems (See Glossary, Table 1. http://www.corestandards.org/the-standards/mathematics/glossary/glossary/ ) using information presented in a bar graph.
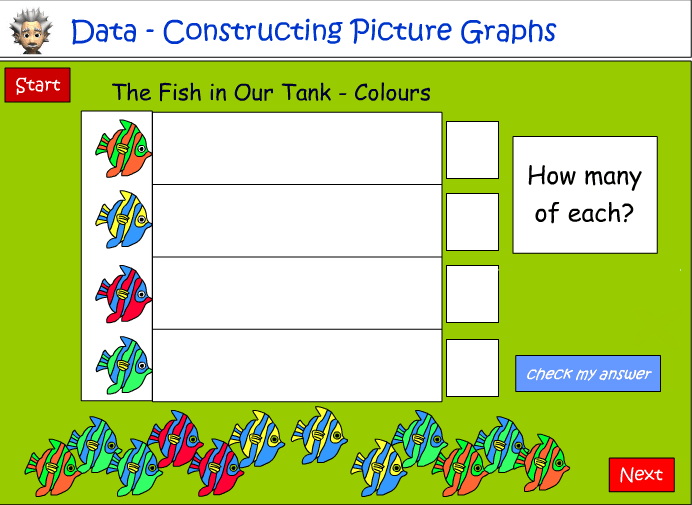
Samples: Data - picture graphs: Activity 1. Interpreting Column Graphs - 3. Graphs. Data - picture graphs: Activity 2.
Mathematics
3.MD.3 – Draw a scaled picture graph and a scaled bar graph to represent a data set with several categories. Solve one- and two-step “how many more” and “how many less” problems using information presented in scaled bar graphs. For example, draw a bar graph in which each square in the bar graph might represent 5 pets.
Samples: Data in tables: Activity 1. Data - tally marks: Activity 1. Interpret data in lists.
Data representation and interpretation
ACMSP068 – Identify questions or issues for categorical variables. Identify data sources and plan methods of data collection and recording
Samples: Graphs. Data - picture graphs: Activity 1. Interpreting Column Graphs - 3. Surveys to collect data.
ACMSP069 – Collect data, organise into categories and create displays using lists, tables, picture graphs and simple column graphs, with and without the use of digital technologies
Samples: Graphs. Data - picture graphs: Activity 1. Interpreting Column Graphs - 3. Surveys to collect data.
ACMSP070 – Interpret and compare data displays
Samples: Graphs. Data - picture graphs: Activity 1. Interpreting Column Graphs - 3. Surveys to collect data.
3.S.1 – Investigate questions by using the statistical enquiry cycle (with support):
3.S.1.a – Gather and display category and simple whole-number data
Samples: Answer simple questions to collect data. Using simple questions to gather data. Interpret data as drawings.
3.S.1.b – Interpret displays in context
Samples: Data - less or more. Answer simple questions to collect data. Using simple questions to gather data.
4.S.1 – Investigate questions by using the statistical enquiry cycle independently:
4.S.1.a – Gather and display category and simple whole-number data
Samples: Using simple questions to gather data. Interpret data as drawings. Graphs. Data - picture graphs: Activity 1.
4.S.1.b – interpret displays in context
Samples: Using simple questions to gather data. Interpret data as drawings. Graphs. Data - picture graphs: Activity 1.
5.S.1 – Investigate summary and comparison questions by using the statistical enquiry cycle:
5.S.1.a – Gather, display, and identify patterns in category and whole-number data
Samples: Graphs. Data - picture graphs: Activity 1. Interpreting Column Graphs - 3. Surveys to collect data. Graphs.
5.S.1.b – Interpret results in context
Samples: Graphs. Data - picture graphs: Activity 1. Interpreting Column Graphs - 3. Surveys to collect data. Graphs.
KS2.Y3.S – Statistics
Pupils should be taught to:
KS2.Y3.S.1 – Interpret and present data using bar charts, pictograms and tables
Samples: Data - picture graphs: Activity 1. Surveys to collect data. Data - picture graphs: Activity 2.