To save results or sets tasks for your students you need to be logged in. Studyladder is free to join Join Now, Free
What a brilliant site you have!!! I love it, especially as it saves me hours and hours of hard work. Others who haven't found your site yet don't know what they are missing!
Mathematics
5.MD.2 – Make a line plot to display a data set of measurements in fractions of a unit (1/2, 1/4, 1/8). Use operations on fractions for this grade to solve problems involving information presented in line plots. For example, given different measurements of liquid in identical beakers, find the amount of liquid each beaker would contain if the total amount in all the beakers were redistributed equally.
Samples: Reading a line plot - fractions of an inch. Interpreting Dot Plots. Interpret a dot plot. Line graphs.
Data representation and interpretation
ACMSP118 – Pose questions and collect categorical or numerical data by observation or survey
Samples: Graphs. Interpreting column graphs - 5. Interpreting Dot Plots. Interpreting a pie graph. Interpret a spreadsheet.
ACMSP119 – Construct displays, including column graphs, dot plots and tables, appropriate for data type, with and without the use of digital technologies
Samples: Graphs. Interpreting column graphs - 5. Interpreting Dot Plots. Interpreting a pie graph. Interpret a spreadsheet.
ACMSP120 – Describe and interpret different data sets in context
Samples: Graphs. Interpreting column graphs - 5. Interpreting Dot Plots. Interpreting a pie graph. Interpret a spreadsheet.
Data representation and interpretation
ACMSP147 – Interpret and compare a range of data displays, including side-by-side column graphs for two categorical variables
Samples: Graphs. Interpreting column graphs - 5. Interpreting Dot Plots. Interpreting a pie graph. Interpret a spreadsheet.
ACMSP148 – Interpret secondary data presented in digital media and elsewhere
Samples: Graphs. Interpreting column graphs - 5. Interpreting Dot Plots. Interpreting a pie graph. Interpret a spreadsheet.
6.S.1 – Investigate summary and comparison questions by using the statistical enquiry cycle:
6.S.1.a – Gather or access multivariate category and whole-number data
Samples: Surveys to collect data. Graphs. Two way tables. Interpreting column graphs - 4.
6.S.1.b – Sort data into categories or intervals, display it in different ways, and identify patterns
Samples: Surveys to collect data. Graphs. Two way tables. Interpreting column graphs - 4.
6.S.1.c – Interpret results in context, accepting that samples vary
Samples: Surveys to collect data. Graphs. Two way tables. Interpreting column graphs - 4.
7.S.1 – Investigate summary, comparison, and relationship questions by using the statistical enquiry cycle:
7.S.1.a – Gather or access multivariate category and measurement data
Samples: Graphs. Interpreting column graphs - 5. Interpreting Dot Plots. Interpreting a pie graph. Interpret a spreadsheet.
7.S.1.b – Sort data and display it in multiple ways, identifying patterns and variations
Samples: Graphs. Interpreting column graphs - 5. Interpreting Dot Plots. Interpreting a pie graph. Interpret a spreadsheet.
7.S.1.c – Interpret results in context, accepting that samples vary and have no effect on one another
Samples: Graphs. Interpreting column graphs - 5. Interpreting Dot Plots. Interpreting a pie graph. Interpret a spreadsheet.
KS2.Y4.S – Statistics
Pupils should be taught to:
KS2.Y4.S.1 – Interpret and present discrete and continuous data using appropriate graphical methods, including bar charts and time graphs
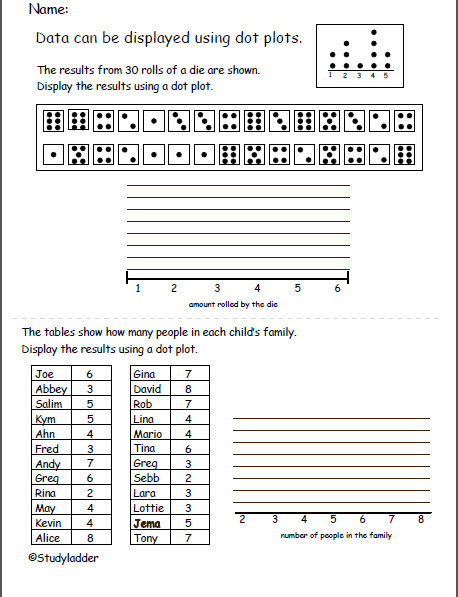
Samples: Interpreting Dot Plots. Interpret a spreadsheet. Display data using dot plots. Adding information to a spreadsheet.